Jeeves Visualization
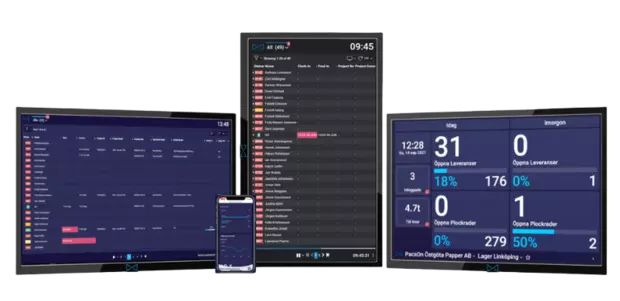
Jeeves Visualisation helps you visualise your data and make it easy to understand, so that your employees are aligned with the goals you are trying to achieve. This increases motivation and engagement, promotes efficiency and ultimately leads to happier employees and customers.

Jeeves Visualisation provides a clear, comprehensive understanding of data, fostering organisational involvement and engagement. This translates into improved efficiency and customer and employee satisfaction. With this tool, you can customise the information displayed on screens or handheld devices, ensuring that employees have the insights they need for their roles. Whether you use our pre-designed views or create your own, the possibilities for presenting data are limitless, only limited by your imagination.
Fostering a unified vision
Setting and achieving goals is fundamental to any business. Objectives typically revolve around quantifiable metrics that represent our performance and direction. Ensuring that everyone understands these metrics is essential to achieving goals. Equipped with the right information, you can make critical decisions and prioritise effectively. What are today's goals? What steps are needed to achieve them? Are things going smoothly or are there challenges? With clear goals, it becomes easier for everyone to share a unified vision.
Saves time
Jeeves Visualization streamlines processes, saving time and automating previously manual tasks such as data entry into the ERP system and the creation of Excel lists. It also minimises errors and makes it easier to track and achieve organisational, departmental and individual goals.
Understanding numbers brings value
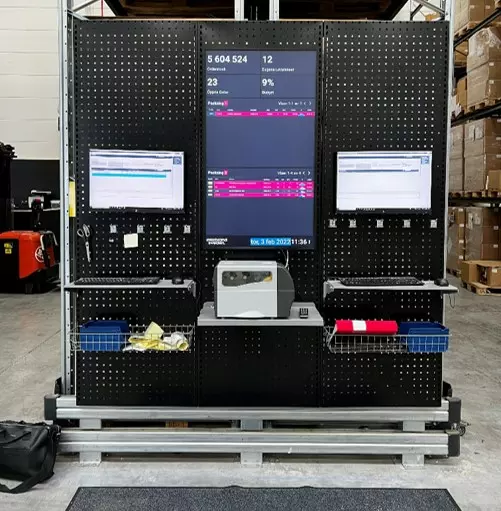
Data visualisation benefits a wide range of departments, including production, procurement, inventory management, customer order processing and finance. It can also be beneficial in public spaces such as reception areas or cafeterias.
Integrated to Jeeves ERP
Jeeves Visualization is seamlessly integrated with Jeeves ERP, allowing you to effortlessly view and visualise all your ERP system data. Our customisable framework can be extended and developed as required. You can choose from our pre-defined views or build a customised solution to meet your specific needs. Data can be displayed in multiple locations across the organisation and updated in real-time or at scheduled intervals throughout the day.
Examples of use areas
- Project-driven manufacturing
- Warehouse
- Production
- Purchasing
- Goods receiving
- Quality assurance
- Finance
- IT management
- Human Resources
Jeeves Visualization makes the difference
The potential for using data to engage employees and align everyone around common goals is limitless. What data would make your day-to-day operations easier? Contact us and we can work together to develop a customised view that meets your needs.
Everbrand streamlines with Visualization
Hos Everbrand lorem ipsum euismod laoreet vehicula mi hendrerit himenaeos sociosqu purus lectus semper netus, dictumst ornare dictumst viverra ac id taciti pretium quam metus. Ultrices proin odio posuere venenatis est dictum nunc erat suscipit lectus arcu luctus feugiat, egestas ultricies sem fringilla pharetra interdum etiam sit quisque habitasse tristique elementum. Non per mi suscipit cursus egestas nam odio mollis class neque, elementum malesuada pretium imperdiet quisque a lobortis hac potenti maecenas tellus, vestibulum ornare rutrum tellus non nunc leo ac convallis.
