Jeeves BI
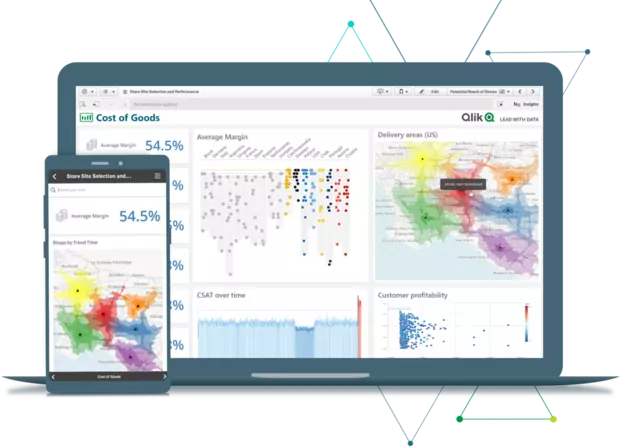
Jeeves BI, powered by Qlik Sense, consolidates your sales, financial, purchasing and production data quickly and easily. It then delivers easy-to-use dashboards with filterable charts and figures for seamless interpretation.

Jeeves BI provides an overview of business performance from multiple perspectives, with the ability to drill down into the underlying details for additional information or to create your own reports.
Organisational monitoring development and improvement
Jeeves Business Intelligence is designed for companies in the distribution, manufacturing and service industries that want to take their analysis and decision-making capabilities to the next level. Whether it's an internal desire to monitor critical KPIs more closely, or external factors that challenge an organisation to ask tough questions, Jeeves BI is the answer.
Separate applications areas
Jeeves BI consists of four separate applications for sales, finance, purchasing and manufacturing. Based on a common data layer within Qlik Sense, the applications can quickly visualise data, making information easily accessible to drive faster and better business decisions.
Each application has a dashboard showing the current value of various KPIs and charts showing the ratios, trends and variances of the factors from which the KPIs are calculated. An analysis view allows the underlying transactions to be identified, filtered and exported to Excel. A report view allows users to freely create and export their own charts based on the dimensions and KPIs contained in the data layer.
Flexible and customisable
Unlike many other analysis tools, users are not limited to pre-defined questions. With Jeeves BI, users can perform multi-dimensional analysis, and from the results have the flexibility to explore additional information.

The Benefits
- Quickly access pre-built reports and dashboards that are easy to modify to meet specific needs
- Perform multi-dimensional analysis that allows the flexibility to explore additional information
- Discover new insights about the business by tapping into the historical and transactional data in Jeeves ERP
- Easily report on data from external sources
- Improve tracking of business KPIs
Examples of Analyses
- Compare the current balance of an account or group of accounts with the previous year based on rolling periods.
- Compare the sales against the cash contribution at the customer level on a monthly basis. Identify which customers are profitable, what they buy, as well as which products have potential and which should be discontinued.
- Get an instant liquidity forecast by viewing a line graph of the sum of cash, accounts payable and accounts receivable on a weekly basis.
- View sales against credit at the customer level to identify customers with high credit costs.
- Identify bottlenecks by looking at the number of late receipts to the warehouse, from production or purchasing, by location, group or item.
- See how capital formation changes over time with monthly bar charts of inventory levels and inventory value per item, item group or warehouse.
- Track supplier delivery accuracy over time and establish controls for when it's time to renegotiate delivery terms.